
New Farm QLD Suburb Profile 2026: House Prices, Rent, Schools and Lifestyle

By Tim AllenBuyer’s Agent and Director, IPS Buyer’s Agents
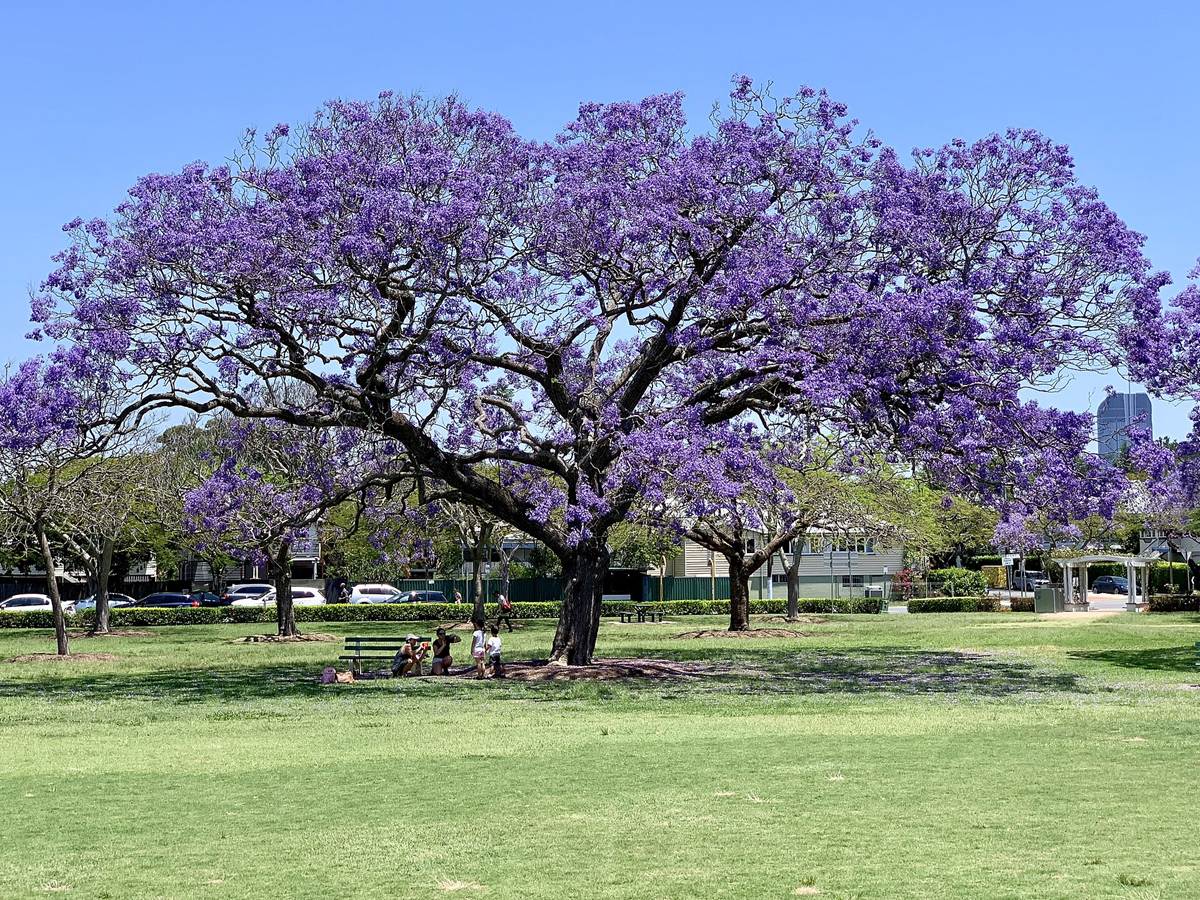
Jacarandas in New Farm Park, October 2018. Photo: Chris Olszewski, CC BY-SA 4.0, via Wikimedia Commons.
New Farm (postcode 4005) is an inner-city riverside suburb of about 12,200 people in Brisbane City Council, 2 km east of the CBD. Three in four homes are apartments or units, with Queenslanders and Federation houses in the streets between, and the Brisbane River wraps part of the suburb. In October 2026 the median unit value was about $1.19 million and the median house value about $2.93 million, two-bedroom units were renting for $750 a week, and the rental vacancy rate for the 4005 postcode was 1.87%.
Checked 15 November 2026. Every figure names its source, and the full list is under References at the end.
New Farm at a glance
| New Farm, QLD 4005 | Figure | Source |
|---|---|---|
| Council | Brisbane City Council | Queensland Government |
| Distance to Brisbane CBD | 2 km east; 7 min drive off-peak, 6 to 18 min leaving at 7.30am | Google Maps, Nov 2026 |
| Population | 12,197 people, median age 39 | ABS Census 2021 |
| Median unit value | $1,191,925 | Cotality, Oct 2026 |
| Median house value | $2,929,490 | Cotality, Oct 2026 |
| Median price, 2-bedroom unit | $1.1 million (113 sales, 20 days on market) | Domain, 12 months to Nov 2026 |
| Value growth | Units +1.6% over 1 year and +62.3% over 5 years; houses +0.6% and +20.4% | Cotality, Oct 2026 |
| Median rent, 2-bedroom unit | $750 a week, up 7% in a year | RTA, Sep quarter 2026 |
| Gross rental yield | Units 3.0%, houses 1.8% | Cotality, Oct 2026 |
| Rental vacancy rate (postcode 4005) | 1.87% | SQM Research, Oct 2026 |
| Homes | 74.5% apartments or flats; 53% rented | ABS Census 2021 |
| State school catchments | New Farm State School; Fortitude Valley State Secondary College | Queensland Government, Jul 2026 |
| Public transport | CityCat ferries at Sydney Street and New Farm Park; BUZ buses 196 and 199 | Translink |
| Nearest regional hub | Brisbane CBD (the region’s primary activity centre) | SEQ Regional Plan 2009–2031 |
| Biggest build nearby | Little Italy, Newstead ($1.5 billion, about 700 apartments): due by 2029 | The Urban Developer, Mar 2026 |
| Reported offences | 1,504 in 12 months: about 123 per 1,000 residents (Brisbane: 90) | QPS Online Crime Map, Nov 2026 |
Is New Farm a good place to live?
New Farm suits people who want to walk to the river, the park and the city, and who are happy with apartment living or a top-end price for a house. At the 2021 Census, 74.5% of its homes were flats or apartments, 53% were rented and 42.5% were single-person households, against 24.7% across Queensland. The median age was 39 and the median household income $2,069 a week (Queensland: $1,675).
It is really three suburbs in one, and each comes with its own checks.
| Part of New Farm | What you get | What to check |
|---|---|---|
| Riverfront, apartments by the river | River views and the Riverwalk at the door | Body corporate costs, and flood levels for the car park |
| Character streets, pre-1947 homes | Queenslanders and Federation homes | Controls on demolition, and parking |
| The village end, near Merthyr Village and Brunswick Street | A walk to cafés, the park and the bus | Evening noise, events and street parking |
Far fewer people drive to work here than across Queensland: on Census day 2021, 34% of New Farm’s workers drove (Queensland: 60%), 9% walked, 10% took public transport and 27% worked from home.
What is the median house price in New Farm?
New Farm’s median house value was $2,929,490 at the end of October 2026 and its median unit value $1,191,925, according to Cotality, and two-bedroom units, the most traded homes, sold for a median $1.1 million over the past year (Domain). Values barely moved in the past year, up 0.6% for houses and 1.6% for units, after strong growth earlier in the decade.
Market trends by bedrooms (sales in the 12 months to November 2026, Domain):
| Home | Median price | Average days on market | Auction clearance | Sold in 12 months |
|---|---|---|---|---|
| 1-bedroom unit | $722,500 | 15 | – | 77 |
| 2-bedroom unit | $1,100,000 | 20 | 59% | 113 |
| 3-bedroom unit | $2,200,000 | 33 | 56% | 53 |
| 3-bedroom house | $2,850,000 | – | – | 17 |
| 4-bedroom house | $3,610,000 | 40 | 25% | 28 |
| 5-bedroom house | $5,350,000 | – | – | 12 |
Growth over 1, 5, 10 and 17 years:
| Period | Units | Houses | Source |
|---|---|---|---|
| 1 year, Nov 2025 to Oct 2026 | +1.6% | +0.6% | Cotality, median value |
| 5 years to Oct 2026 | +62.3% (10.2% a year) | +20.4% (3.8% a year) | Cotality, median value |
| 9 years, Oct 2017 to Oct 2026 | +105.7% (8.3% a year) | +92.1% (7.5% a year) | Cotality, median value |
| 17 years, May 2009 to Nov 2026 (postcode 4005) | $548,000 to $1,483,633, +171% (5.8% a year) | $945,000 to $3,210,046, +240% (7.2% a year) | SQM Research, asking prices |
The free sources reach back to 2009. A 20- or 30-year sales median needs paid sales data such as Pricefinder.
A two-bedroom unit in New Farm rents for about $750 a week: that was the median on new leases in the September quarter 2026, up from $700 a year earlier and $435 in September 2017, according to the Residential Tenancies Authority’s bond data.
| September quarter | 2-bedroom unit, New Farm (median weekly rent) |
|---|---|
| 2017 | $435 |
| 2019 | $470 |
| 2021 | $485 |
| 2022 | $550 |
| 2023 | $620 |
| 2024 | $650 |
| 2025 | $700 |
| 2026 | $750 |
In the same quarter one-bedroom units rented for $580 a week, three-bedroom units for $1,100 and three-bedroom houses for $1,150 (RTA).
Rental yield and vacancy. Cotality puts New Farm’s gross yield at 3.0% for units and 1.8% for houses. A two-bedroom unit at the $1.1 million median, rented at $750 a week, yields 3.5% before costs. SQM Research counted a vacancy rate of 1.87% for the 4005 postcode in October 2026, still under the 2.6% to 3.5% the REIQ treats as a healthy market.
All of New Farm is in the catchment of New Farm State School (Prep to Year 6) and Fortitude Valley State Secondary College (Years 7 to 12), going by the Queensland Government’s July 2026 maps.
| State school | Share of New Farm in its catchment | 2025 score (Better Education) | Enrolment management plan |
|---|---|---|---|
| New Farm State School | 100% | 98 | Yes (room for 745) |
| Fortitude Valley State Secondary College | 100% | 91 | Yes |
Both schools run enrolment management plans, so they take children from outside the catchment only when they have room. To enrol, you prove the address with a current lease, a rates notice or an unconditional contract, plus a utility bill, and your child must already live there when you apply. Check the exact address in the Queensland Government’s EdMap first. Fortitude Valley State Secondary College opened in 2020, next door in Fortitude Valley. The scores are Better Education’s, a third party’s ranking built on NAPLAN results; the Catholic Holy Spirit School (Prep to Year 6) in New Farm scores 94.
New Farm is 2 km east of the Brisbane CBD. Driving to King George Square takes about 7 minutes outside peak hour and 6 to 18 minutes leaving at 7.30am on a weekday, and public transport takes about 15 minutes, according to Google Maps.
| From New Farm to | How | Typical time |
|---|---|---|
| Brisbane CBD (King George Square) | Car, leaving 7.30am weekday (3.0 km) | 6 to 18 min |
| Brisbane CBD | Car, off-peak | 7 min |
| Brisbane CBD | Bus or ferry, leaving 7.30am weekday | 15 min |
| Brisbane Airport | Car, off-peak | 18 min |
| Sunshine Coast (Mooloolaba Beach) | Car, off-peak | 1 hr 22 min |
| Gold Coast (Surfers Paradise) | Car, off-peak | 1 hr 3 min |
CityCats stop at Sydney Street and New Farm Park, and BUZ routes 196 and 199 run to the city. Times were checked in Google Maps on 15 November 2026; time the trip you will actually make before you buy.
The Brisbane CBD, about 3 km away, is New Farm’s hub. The South East Queensland Regional Plan 2009–2031 named it the region’s primary activity centre, with the most jobs and services in South East Queensland, and noted its role spreading into the “frame” suburbs around it, including Fortitude Valley, Newstead, Bowen Hills, Spring Hill and West End. The nearest principal regional activity centres, the next level down, are Chermside, Indooroopilly, Carindale and Upper Mount Gravatt.
Brisbane is expected to keep growing inwards. The 2017 ShapingSEQ background paper on growth set Brisbane a benchmark of 188,200 more homes between 2016 and 2041, 176,800 of them in existing urban areas, which in suburbs like New Farm usually means apartments.
The biggest build near New Farm is Little Italy, a $1.5 billion precinct of three towers with about 700 apartments around an Italian-style piazza of restaurants, bars and shops, on Longland Street, Newstead, about 2 km north. Developer Panettiere broke ground on the first tower in March 2026, and the precinct is expected to be finished by 2029.
- What it adds: the 31-storey ORO tower, with 197 apartments, comes first; the Bianco and Argento towers follow in later stages.
- Where it is up to: work on the first stage started on 19 March 2026.
- When: by 2029 for the precinct, its developer expects.
What it means if you buy in New Farm: more restaurants and bars a short ride away, and hundreds of new apartments nearby, which matters most if you are buying a unit to rent out. If you are looking in Teneriffe or Newstead, check the construction hours and traffic around Longland Street.
Most jobs are within a short trip: the CBD and Fortitude Valley are next door, and the Herston hospital and university precinct, which the 2009 plan named a specialist activity centre, is a few kilometres north-west. Brisbane Airport and the Australia TradeCoast enterprise area are about 18 minutes away.
- Jobs (2021 Census): professionals 41.5% (Queensland 21.4%), managers 18.0%, clerical and administrative workers 11.4%.
- Top industries: hospitals 5.9%, cafés and restaurants 4.6%, legal services 4.5% (Queensland 0.9%), computer system design 2.6% and real estate services 2.5%.
- Work patterns: 68% of adults were in the labour force (Queensland 61.6%) and 4.2% were unemployed (Queensland 5.4%).
New Farm’s reported crime rate is higher than Brisbane’s average, as is usual for an inner-city suburb with busy bars, venues and parks. It recorded 1,504 offences on the Queensland Police Service’s online crime map in the 12 months to 14 November 2026, about 123 for every 1,000 residents, against 90 per 1,000 across Brisbane City (112,378 offences).
| Offence type | New Farm, 12 months to 14 Nov 2026 |
|---|---|
| Drug offences | 563 |
| Other theft (not break-ins) | 344 |
| Unlawful entry (break-ins) | 119 |
| Other | 89 |
| Assault | 72 |
| Good order offences | 70 |
| Property damage | 68 |
| Unlawful use of a motor vehicle | 47 |
| Handling stolen goods | 44 |
| Weapons Act offences | 44 |
| Traffic and related offences | 44 |
Drug offences are mostly found by police rather than reported by victims, so they rise where police patrol. Visitors to the Powerhouse, the park and the bars are not counted as residents, which pushes the rate per resident up. Police say the map’s figures are not official statistics and its locations show a general area; the rates use 2021 Census populations. Before you buy, look up your own street on the map.
New Farm Park, the Brisbane Powerhouse and the Riverwalk are all on foot, with cafés along Brunswick Street and Merthyr Road. Ratings are Google’s, checked 15 November 2026.
Parks and the river
- New Farm Park: 4.7 stars from 5,039 reviews, with jacarandas, rose gardens, a rotunda, playgrounds and a ferry terminal.
- Powerhouse Park: 4.7 from 493 reviews.
- Merthyr Park, Oxlade Drive: 4.6 from 154 reviews.
- The New Farm Riverwalk into the city, rebuilt after the 2011 flood swept part of the old floating walkway away.
Food and coffee
- Dicki’s, Brunswick Street, for vegan food: 4.8 from 767 reviews.
- Blue Bear Coffeehouse, James Street: 4.7 from 784 reviews.
- Continental Cafe, Barker Street: 4.7 from 315 reviews.
- New Farm Bistro, Gray Street: 4.8 from 167 reviews.
For kids
- New Farm Park Playground: 4.8 from 372 reviews.
- A CityCat ride from New Farm Park, up or down the river.
- Kangaroo Point Cliffs Park, across the river: 4.7 from 7,252 reviews.
For adults
- Brisbane Powerhouse, the old tram power station, now an arts and performance space: 4.6 from 5,574 reviews.
- The Triffid, a live music venue next door in Newstead: 4.6 from 3,012 reviews.
- The Junk Bar, Brunswick Street: 4.7 from 535 reviews.
The local pub
The Brunswick Hotel, 569 Brunswick Street: a proper local pub, rated 4.5 from 1,858 Google reviews, and our pick for a meal or a drink close to home.
Check the river, the building and the overlay before you talk price in New Farm. The view and the walk to the park are only worth paying for once all three are clear.
- The river. In January 2011 the flood broke away a large section of the old floating Riverwalk. Run council’s free FloodWise Property Report for the exact address, and ask where the car park sits.
- The building. Most New Farm homes are units, so read the body corporate records before you sign: the sinking fund, the minutes and what is due for repair. Our guide to body corporate searches shows how.
- The house. Many pre-1947 homes sit in council’s traditional building character overlay, which controls demolition. Check what you could actually change.
- The street. Visit on a Saturday night and at 8am on a weekday: the noise, the parking and the walk to the ferry.
IPS Buyer’s Agents buys across Brisbane for owner-occupiers and investors, including a first home in Yeronga and family homes at The Gap and Upper Mount Gravatt. A New Farm listing sells the river and the walk to the park, so Zian and I check the flood report, the body corporate or the character overlay, and the parking before we talk price.
Comparing New Farm with Teneriffe, Bulimba or Paddington? Book a free call and tell us your brief. See how we work as a Brisbane buyer’s agent, our other Brisbane suburb reports and the Brisbane property market update.
Is New Farm in Brisbane City Council?
Yes. New Farm is in Brisbane City Council, so its rates, planning rules, character overlays and flood maps all come from Brisbane City Council.
What is New Farm’s postcode?
4005, which New Farm shares with Teneriffe. Figures published by postcode, such as SQM Research’s vacancy rate, cover both suburbs.
What is the population of New Farm?
About 12,200. The 2021 Census counted 12,197 people in New Farm, with a median age of 39, and 42.5% of its households were people living alone.
Can you catch a ferry from New Farm?
Yes. CityCats stop at Sydney Street and New Farm Park, and BUZ bus routes 196 and 199 also run to the city.
Does New Farm flood?
Parts of it can: the 2011 flood swept away part of the old floating Riverwalk. Run Brisbane City Council’s free FloodWise Property Report for the exact address, including where an apartment’s car park sits.
Can you knock down an old house in New Farm?
Not freely. Many pre-1947 homes are in council’s traditional building character overlay, which controls demolition, so check the overlay and what council would approve before you buy to rebuild.
What is New Farm Park known for?
Its jacarandas, rose gardens, rotunda and playgrounds by the river. It is rated 4.7 from more than 5,000 Google reviews and has its own CityCat terminal.
How many homes sell in New Farm each year?
Around 270. Cotality counts 268 sales in the 12 months to October 2026, and Domain counts 243 unit sales, two-bedroom units the most common, against about 60 house sales.
- Cotality via OnTheHouse: New Farm suburb profile (median values, growth, rents, yields), as at 31 October 2026
- Domain: New Farm suburb profile, market trends by bedrooms, checked 15 November 2026
- Residential Tenancies Authority: median rents by suburb, September quarter 2026
- SQM Research: vacancy rates and asking prices for postcode 4005
- Australian Bureau of Statistics: 2021 Census QuickStats, New Farm
- Queensland Government: state school catchments, July 2026
- Department of Education: New Farm State School enrolment management plan
- Better Education: 2025 school scores
- Queensland Police Service: Online Crime Map, 15 November 2025 to 14 November 2026
- Queensland Government: South East Queensland Regional Plan 2009–2031, Part C (Brisbane) and Maps 10 and 11
- Queensland Government: ShapingSEQ 2017, Background paper 1: Grow, Table 9 (dwelling supply benchmarks to 2041)
- Brisbane City Council: FloodWise Property Reports
- Brisbane City Council: New Farm Park facilities
- Queensland Reconstruction Authority: Brisbane ferry terminals and Riverwalk
- Wikipedia: New Farm, Queensland
- The Urban Developer: Brisbane’s $1.5bn Triple Tower ‘Little Italy’ Breaks Ground, 19 March 2026
- The Urban List: Little Italy, Newstead (completion expected by 2029)
- Google Maps: drive and transit times and ratings, checked 15 November 2026