
Tarragindi QLD Suburb Profile 2026: House Prices, Rent, Schools and Lifestyle

By Tim AllenBuyer’s Agent and Director, IPS Buyer’s Agents
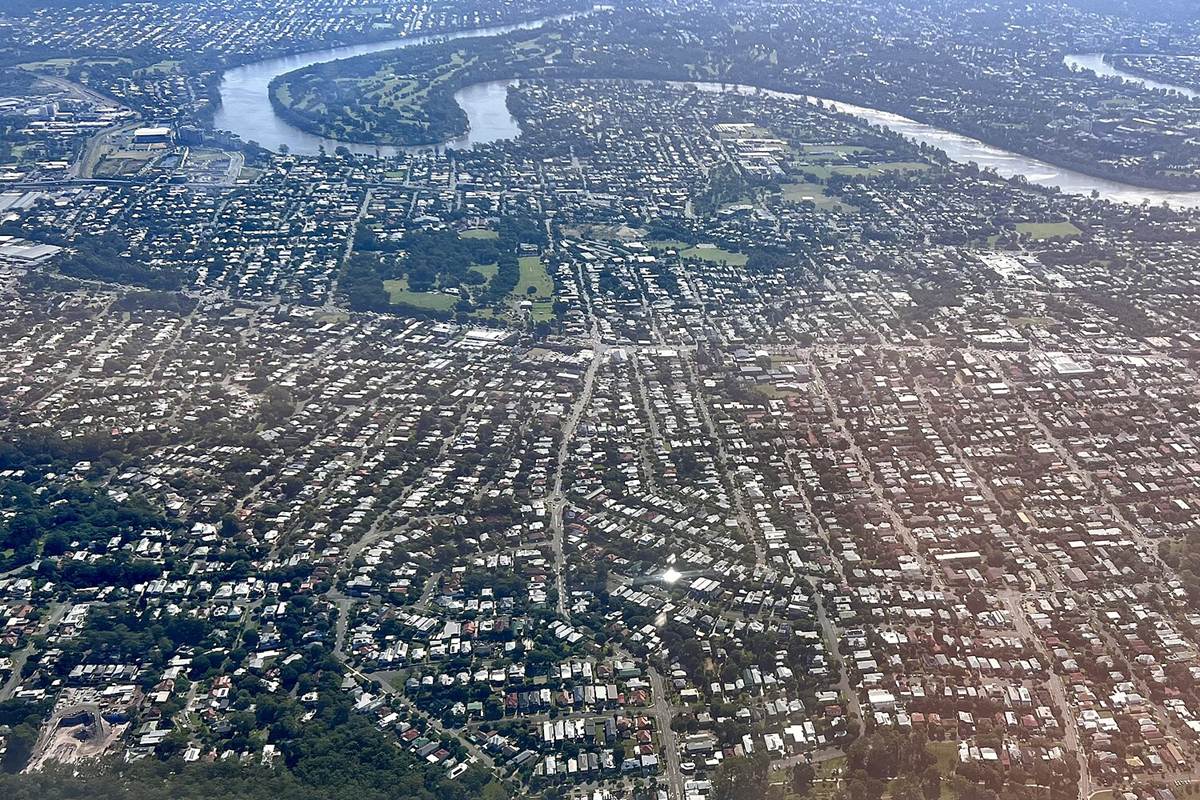
Tarragindi from the air, March 2022. Photo: Kgbo, CC BY-SA 4.0, via Wikimedia Commons.
Tarragindi (postcode 4121) is a leafy family suburb on Brisbane’s southside, home to about 11,000 people in Brisbane City Council, about 10 km south of the CBD by road, next to the bushland of Toohey Forest. Almost every home is a house, many of them older Queenslanders and postwar homes, with a village strip of cafés on Denham Terrace. In October 2026 the median house value was about $1.53 million, three-bedroom houses were renting for $825 a week, and the rental vacancy rate for the 4121 postcode was 0.91%.
Checked 16 November 2026. Every figure names its source, and the full list is under References at the end.
Tarragindi at a glance
| Tarragindi, QLD 4121 | Figure | Source |
|---|---|---|
| Council | Brisbane City Council (Holland Park Ward) | Queensland Government; Brisbane City Council |
| Distance to Brisbane CBD | About 10 km by road; 10 min drive off-peak, 14 to 30 min leaving at 7.30am | Google Maps, Nov 2026 |
| Population | 11,035 people, median age 37 | ABS Census 2021 |
| Median house value | $1,526,998 | Cotality, Oct 2026 |
| Median price, 3-bedroom house | $1,450,000 (56 sales, 18 days on market) | Domain, 12 months to Nov 2026 |
| House value growth | −9.3% over 12 months, +34.1% over 5 years, +102.3% since Oct 2017 | Cotality, Oct 2026 |
| Median rent, 3-bedroom house | $825 a week, up 18% in a year | RTA, Sep quarter 2026 |
| Gross rental yield | Houses 2.6%, units and townhouses 3.8% | Cotality, Oct 2026 |
| Rental vacancy rate (postcode 4121) | 0.91% | SQM Research, Oct 2026 |
| Homes | 95% separate houses; 49% have four or more bedrooms | ABS Census 2021 |
| State school catchments | Mostly Wellers Hill State School and Holland Park State High | Queensland Government, Jul 2026 |
| Public transport | Buses to the city (routes 114, 119 and 120) | Translink; Google Maps |
| Nearest regional hub | Brisbane CBD (10 min); Upper Mount Gravatt (8 to 10 min) | SEQ Regional Plan 2009–2031 |
| Biggest build nearby | Cross River Rail, with a new underground station at Boggo Road | Cross River Rail, Nov 2026 |
| Reported offences | 376 in 12 months: about 34 per 1,000 residents (Brisbane: 90) | QPS Online Crime Map, Nov 2026 |
Is Tarragindi a good place to live?
Tarragindi suits families who want a house with a yard 10 minutes from the CBD, in a top-scoring primary school catchment, with Toohey Forest on the doorstep. The trade-offs are the price, around $1.5 million for a house, older homes that need careful building checks, and a few streets near the creeks and gullies. At the 2021 Census, 95% of homes were separate houses, 56% of families were couples with children (Queensland: 41%), only 20% of households rented, and the median household income was $2,934 a week (Queensland: $1,675).
It is really three suburbs in one, and each comes with its own checks.
| Part of Tarragindi | What you get | What to check |
|---|---|---|
| The Wellers Hill end, older streets near Denham Terrace | Queenslanders and postwar houses, with cafés and Wellers Hill State School close by | Brisbane City Plan’s character overlays, and building, pest and asbestos checks |
| Family streets in the middle of the suburb | Houses on suburban blocks near the schools and parks | The catchment for the exact address, and the flood map near the creeks |
| The Toohey Forest side | Bush outlooks and the forest’s tracks | The bushfire and landslide overlays, and the slope of the block |
What is the median house price in Tarragindi?
Tarragindi’s median house value was $1,526,998 at the end of October 2026, 9.3% lower than a year earlier, according to Cotality, while three-bedroom houses sold for a median of $1.45 million over the past year (Domain), up from $1.32 million in 2025 and $1.12 million in 2022. Four- and five-bedroom houses sold for medians of $1.82 million and $2.35 million. Units and townhouses had a median value of $796,668, but very few sell here.
Market trends by bedrooms (sales in the 12 months to November 2026, Domain):
| Home | Median price | Average days on market | Auction clearance | Sold in 12 months | 2022 median |
|---|---|---|---|---|---|
| 3-bedroom house | $1,450,000 | 18 | 76% | 56 | $1,120,000 |
| 4-bedroom house | $1,820,000 | 23 | – | 45 | $1,330,000 |
| 5-bedroom house | $2,350,000 | 29 | 38% | 48 | $1,700,000 |
Growth over 12 months, 5, 9 and 17 years:
| Period | Houses | Units and townhouses | Source |
|---|---|---|---|
| 12 months to Oct 2026 | −9.3% | +3.2% | Cotality, median value |
| 5 years to Oct 2026 | +34.1% (6.0% a year) | +90.5% (13.8% a year) | Cotality, median value |
| 9 years, Oct 2017 to Oct 2026 | +102.3% (8.1% a year) | +108.9% (8.5% a year) | Cotality, median value |
| 17 years, May 2009 to Nov 2026 (postcode 4121) | $520,000 to $1,473,582, +183% (6.1% a year) | $394,000 to $915,448, +132% (4.9% a year) | SQM Research, asking prices |
Cotality’s median value is an estimate across all houses, while Domain’s figures are the prices of the houses that sold, which is why one can fall while the other rises. The 17-year row covers the whole 4121 postcode, which includes Holland Park and Holland Park West. A 20- or 30-year sales median needs paid sales data such as Pricefinder.
A three-bedroom house in Tarragindi rents for about $825 a week: that was the median on new leases in the September quarter 2026, up from $700 a year earlier and $435 in September 2017, according to the Residential Tenancies Authority’s bond data. That is a 90% rise in nine years.
| September quarter | 3-bedroom house, Tarragindi (median weekly rent) |
|---|---|
| 2017 | $435 |
| 2019 | $470 |
| 2021 | $500 |
| 2022 | $610 |
| 2023 | $650 |
| 2024 | $670 |
| 2025 | $700 |
| 2026 | $825 |
In the same quarter four-bedroom houses rented for $895 a week, up from $490 in 2017 (RTA).
Rental yield and vacancy. Cotality puts Tarragindi’s gross yield at 2.6% for houses and 3.8% for units and townhouses. A three-bedroom house at the $1.45 million median, rented at $825 a week, yields 3.0% before costs. SQM Research counted a vacancy rate of 0.91% for the 4121 postcode in October 2026, well under the 2.6% to 3.5% the REIQ treats as a healthy market.
Most of Tarragindi is in the Wellers Hill State School and Holland Park State High School catchments, going by the Queensland Government’s July 2026 maps, with the rest split between Marshall Road and Junction Park state schools and Yeronga State High School.
| State school | Share of Tarragindi’s land in its catchment | 2025 score (Better Education) | Enrolment management plan |
|---|---|---|---|
| Wellers Hill State School | 79% | 96 | Yes |
| Marshall Road State School | 15% | 99 | Yes |
| Junction Park State School | 6% | 97 | Yes |
| Holland Park State High School | 73% | 84 | No |
| Yeronga State High School | 28% | 83 | No |
The shares are of land area, not homes, so put the exact address into the Queensland Government’s EdMap before you rely on a catchment. The three primary schools enforce their catchments under enrolment management plans, so they take children from outside only when they have room; you prove the address with a current lease, a rates notice or an unconditional contract, plus a utility bill. The two high schools were not on the Department of Education’s list of schools with plans when we checked. St Elizabeth’s School, a Catholic primary in the suburb, scored 99. The scores are Better Education’s, a third party’s ranking built on NAPLAN results.
Tarragindi is about 10 km south of the Brisbane CBD by road. Driving to King George Square takes about 10 minutes outside peak hour and 14 to 30 minutes leaving at 7.30am on a weekday, and the bus takes about 32 minutes, according to Google Maps.
| From Tarragindi to | How | Typical time |
|---|---|---|
| Brisbane CBD (King George Square) | Car, leaving 7.30am weekday (9.8 km via the M3) | 14 to 30 min |
| Brisbane CBD | Car, off-peak | 10 min |
| Brisbane CBD | Bus 120 from Toohey Road, leaving 7.33am weekday | 32 min |
| Princess Alexandra Hospital | Car, off-peak | 8 min |
| Westfield Mt Gravatt (Garden City) | Car, off-peak | 8 to 10 min |
| Brisbane Airport | Car, off-peak | 22 min |
| Gold Coast (Surfers Paradise) | Car, off-peak | 50 min to 1 hr |
| Sunshine Coast (Mooloolaba Beach) | Car, off-peak | 1 hr 20 min to 1 hr 30 min |
On Census day 2021, 52% of workers drove or were driven to work, 7% took public transport and 25% worked from home.
The Brisbane CBD, about 10 minutes away, is Tarragindi’s hub. The South East Queensland Regional Plan 2009–2031 named it the region’s primary activity centre, with the most jobs and services in South East Queensland. The nearest principal regional activity centre, the next level down, is Upper Mount Gravatt, around Westfield Mt Gravatt, 8 to 10 minutes away.
Brisbane is expected to keep growing inwards. The 2017 ShapingSEQ background paper on growth set Brisbane a benchmark of 188,200 more homes between 2016 and 2041, 176,800 of them in existing urban areas, so change in a suburb of houses like Tarragindi tends to come one block at a time.
The biggest build near Tarragindi is Cross River Rail, the new rail line under the Brisbane River and the CBD, whose underground station at Boggo Road, 8 to 10 minutes away by car, is set to become South East Queensland’s second-busiest transport interchange.
- Why: more trains through the CBD. The project says the line has capacity to run as many as 24 trains in each direction.
- What it adds near Tarragindi: Boggo Road station, 19 m below ground, linked to the South East Busway, Park Road station and Brisbane Metro, with easier trips to the University of Queensland and the CBD.
- Where it is up to: major construction is under way at all the main station sites. The project’s October to December 2026 update says fit-out is progressing inside and outside Boggo Road station, internal tiling is nearly finished, and testing of station systems is continuing, with sections of Boggo Road and Joe Baker Street closed to through traffic. The project’s pages give no opening date.
- In the suburb: Brisbane City Council is upgrading the Esher Street and Toohey Road intersection (February to late 2026), adding traffic signals with three pedestrian crossings, a wider Sexton Street approach, turning lanes and new paths.
What it means if you buy in Tarragindi: once Cross River Rail opens, a fast rail link from Boggo Road on top of the buses Tarragindi already has, and in the meantime a safer crossing at Esher Street and Toohey Road. Expect detours around Boggo Road while the works finish.
The Princess Alexandra Hospital, 8 minutes away, and the CBD, 10 minutes, are the biggest job centres within reach, with Westfield Mt Gravatt and Griffith University’s Nathan campus, beside Toohey Forest, to the south.
- Jobs (2021 Census): professionals 39.8%, managers 16.2%, clerical and administrative workers 11.8%, community and personal service workers 8.7%.
- Top industries: hospitals 7.9%, primary schools 3.4%, state government administration 2.9%, takeaway food 2.8% and universities 2.8%.
- Work patterns: 73.5% of adults were in the labour force and 3.2% were unemployed (Queensland 5.4%).
Tarragindi’s reported crime rate is about a third of Brisbane’s. It recorded 376 offences on the Queensland Police Service’s online crime map in the 12 months to 15 November 2026, about 34 for every 1,000 residents, against 90 per 1,000 across Brisbane City (112,021 offences). Theft and break-ins make up most of it: break-ins were about one in four offences.
| Offence type | Tarragindi, 12 months to 15 Nov 2026 |
|---|---|
| Other theft (not break-ins) | 136 |
| Unlawful entry (break-ins) | 91 |
| Unlawful use of a motor vehicle | 27 |
| Traffic and related offences | 24 |
| Property damage | 20 |
| Assault | 18 |
| Drug offences | 18 |
| Other | 17 |
| Trespassing | 15 |
| Good order offences | 10 |
Police say the map’s figures are not official statistics and its locations show a general area; the rates use 2021 Census populations. Before you buy, look up your own street on the map, and check the locks, lighting and side access of any house you like.
Toohey Forest’s tracks, small local parks and the Denham Terrace cafés are Tarragindi’s own, with the CBD 10 minutes away. Ratings are Google’s, checked 16 November 2026.
Parks and bushland
- Toohey Forest Park, Toohey Road, Nathan, next door: 4.6 stars from 760 reviews; bushland with walking and cycling tracks and picnic areas.
- Sandy Creek Park, Lana Street: 4.6 from 17 reviews.
- Shaftesbury Street Park: 4.6 from 10 reviews.
- Moorbell Street Park: 4.3 from 15 reviews.
Food and coffee
- Oh Monk Asian, Denham Terrace: 4.8 from 833 reviews.
- Snag & Brown, Ekibin Road, Annerley, next door: 4.6 from 892 reviews.
- Umu Kitchen, Denham Terrace: 4.4 from 441 reviews.
- Lola’s Coffee Bar, Ekibin Road East: 4.6 from 296 reviews.
- Dijon Toasties & Coffee, Esher Street: 4.6 from 212 reviews.
For kids
- Glindemann Park Playground, Logan Road, Holland Park West: 4.4 from 534 reviews.
- Shaftesbury Scooter Park, Shaftesbury Street: 5.0 from 4 reviews.
- Emzia Place Playground, Tarragindi Road: 4.4 from 14 reviews.
- Puzzled Room Escape, Logan Road, for older kids: 4.6 from 699 reviews.
For adults
- Hiker Brewing Co., Pentex Street, Salisbury: 4.8 from 269 reviews.
- Slipstream Brewing Company, Wilkie Street, Yeerongpilly: 4.5 from 688 reviews.
- Easy Times Brewing Company, Logan Road, Woolloongabba: 4.6 from 355 reviews.
The local pub
The Holland Park Hotel, 945 Logan Road, Holland Park, in the same postcode: rated 4.5 from 2,204 Google reviews, with a steakhouse and trivia nights, and our pick for a meal or a drink close to home.
Check the house, the overlays and the school address before you talk price in Tarragindi. The catchment and the forest are only worth it once all three are clear.
- Flood. Brisbane City Council’s Flood Awareness Map shows creek and overland flow flooding for the exact address. Check it for any home near Sandy Creek or a gully.
- The house. Many Tarragindi homes are older Queenslanders and postwar houses, and the QBCC says most homes built before 1990 contain some asbestos, so book building, pest and asbestos checks before you sign.
- Character and planning. Brisbane City Plan’s character overlays can limit demolition and changes to older houses, and the bushfire and landslide overlays apply near the forest. Check the overlays for the lot before you plan a renovation.
- The school address. Wellers Hill’s catchment covers most of the suburb but not all of it. Check the exact address in EdMap, since the primary schools take children from outside only when they have room.
IPS Buyer’s Agents buys across Brisbane for owner-occupiers and investors, including a first home in Yeronga and family homes at The Gap and Upper Mount Gravatt. A Tarragindi listing sells the catchment and the forest, so Zian and I check the flood map, the character overlay and the building report before we talk price.
Comparing Tarragindi with Holland Park, Annerley or Yeronga? Book a free call and tell us your brief. See how we work as a Brisbane buyer’s agent, our other Brisbane suburb reports and the Brisbane property market update.
Is Tarragindi in Brisbane City Council?
Yes. Tarragindi is in Brisbane City Council’s Holland Park Ward, about 10 km south of the CBD by road, so its rates, planning and flood maps come from Brisbane City Council.
What is Tarragindi’s postcode?
4121, which it shares with Holland Park and Holland Park West. Postcode figures, such as SQM Research’s vacancy rate and asking prices, cover all three suburbs.
Which bus goes from Tarragindi to the city?
Routes 114, 119 and 120 all ran to the city in the morning peak when we checked. The 7.33am route 120 from Toohey Road reached King George Square at 8.04am on Google Maps.
Is Tarragindi near Toohey Forest?
Yes. Toohey Forest’s bushland, walking and cycling tracks and picnic areas are on the suburb’s southern edge. Toohey Forest Park, on Toohey Road at Nathan, rates 4.6 from 760 Google reviews.
How many people live in Tarragindi?
About 11,000. The 2021 Census counted 11,035 people with a median age of 37, and 56% of families were couples with children (Queensland: 41%).
Why did Tarragindi’s house values fall in 2026?
Cotality’s estimate of the median house value fell 9.3% in the year to October 2026, but the prices of the houses that sold did not: Domain’s three-bedroom median rose from $1.32 million in 2025 to $1.45 million. Cotality’s figure is a model across all houses, so read both before you judge the market.
How far is Tarragindi from the PA Hospital?
About 8 minutes by car (5.4 km) outside peak times, according to Google Maps. Hospitals employed 7.9% of Tarragindi’s workers at the 2021 Census.
How many homes sell in Tarragindi each year?
Around 150. Cotality counted 150 sales in the 12 months to October 2026, and three-bedroom houses sold in about 18 days on Domain’s figures.
- Cotality via OnTheHouse: Tarragindi suburb profile (median values, growth, rents, yields), as at 31 October 2026
- Domain: Tarragindi suburb profile, market trends by bedrooms, checked 16 November 2026
- Residential Tenancies Authority: median rents by suburb, September quarter 2026
- SQM Research: vacancy rates and asking prices for postcode 4121
- Australian Bureau of Statistics: 2021 Census QuickStats, Tarragindi
- Queensland Government: state school catchments, July 2026
- Department of Education: school enrolment management plans
- Better Education: 2025 school scores
- Queensland Police Service: Online Crime Map, 16 November 2025 to 15 November 2026
- Queensland Government: South East Queensland Regional Plan 2009–2031, Part C (Brisbane)
- Queensland Government: ShapingSEQ 2017, Background paper 1: Grow, Table 9 (dwelling supply benchmarks to 2041)
- Cross River Rail: Boggo Road station
- Cross River Rail: Boggo Road station construction update, October to December 2026
- Brisbane City Council: Esher Street and Toohey Road intersection upgrade, Tarragindi
- Brisbane City Council: Flood Awareness Map
- Brisbane City Council: Brisbane City Plan 2014 (overlays)
- Wikipedia: Tarragindi, Queensland
- Google Maps: drive and transit times and ratings, checked 16 November 2026