
Noosaville QLD Suburb Profile 2026: House Prices, Rent, Schools and Lifestyle

By Tim AllenBuyer’s Agent and Director, IPS Buyer’s Agents
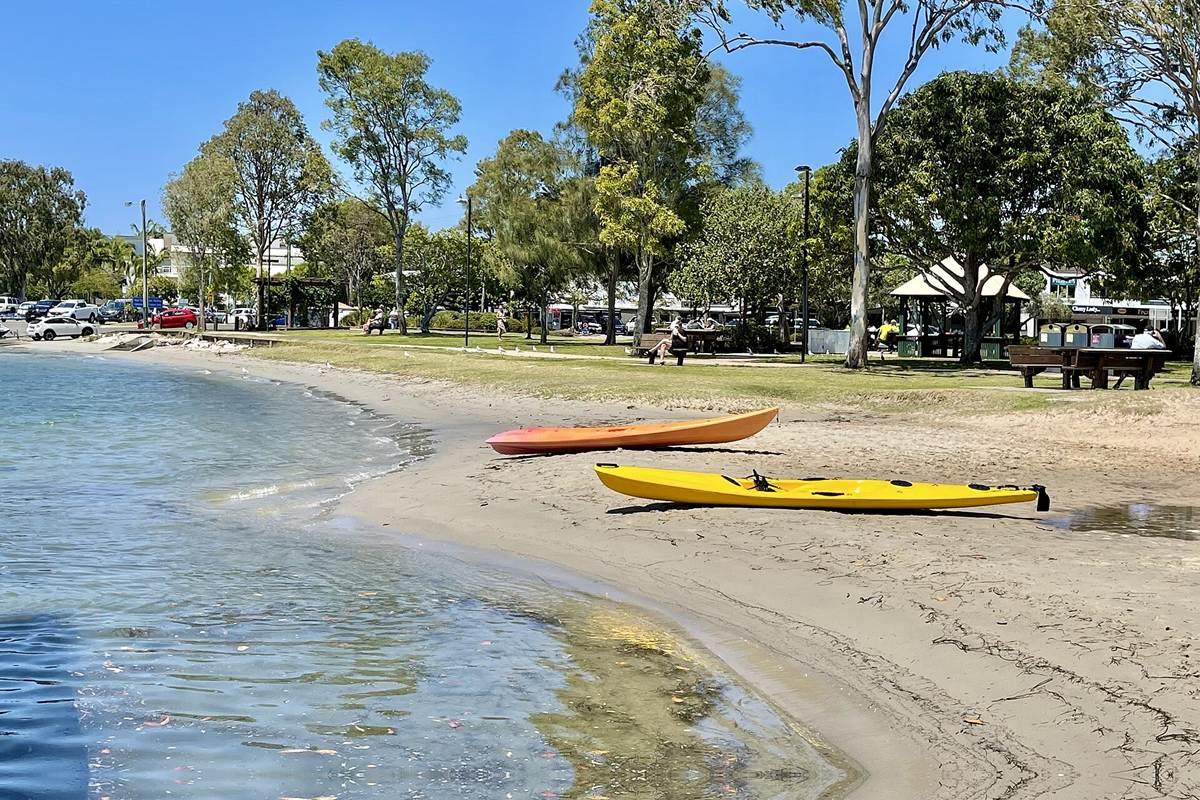
Noosa River beach at Noosaville, October 2021. Photo: Kgbo, CC BY-SA 4.0, via Wikimedia Commons.
Noosaville (postcode 4566) is the riverside suburb between Noosa Heads and Tewantin, home to about 8,700 people in Noosa Shire, about 132 km north of the Brisbane CBD by road, along the Noosa River and Gympie Terrace. Homes range from units and townhouses near the river to canal houses in Noosa Waters and family homes inland, and Hastings Street is 10 minutes away. In October 2026 the median house value was about $2.05 million, two-bedroom units were renting for $780 a week, and the rental vacancy rate for the 4566 postcode was 4.38%.
Checked 16 November 2026. Every figure names its source, and the full list is under References at the end.
Noosaville at a glance
| Noosaville, QLD 4566 | Figure | Source |
|---|---|---|
| Council | Noosa Shire Council | Queensland Government |
| Distance to Brisbane CBD | About 132 km by road; 1 hr 30 min to 1 hr 50 min drive off-peak, 1 hr 40 min to 2 hr 30 min leaving at 7.30am | Google Maps, Nov 2026 |
| Population | 8,716 people, median age 56 | ABS Census 2021 |
| Median house value | $2,053,494 | Cotality, Oct 2026 |
| Median price, 2-bedroom unit | $976,000 (108 sales, 24 days on market) | Domain, 12 months to Nov 2026 |
| House value growth | +1.1% over 12 months, +8.6% over 5 years, +109.4% since Oct 2017 | Cotality, Oct 2026 |
| Median rent, 2-bedroom unit | $780 a week, up 3% in a year | RTA, Sep quarter 2026 |
| Gross rental yield | Houses 2.9%, units and townhouses 3.9% | Cotality, Oct 2026 |
| Rental vacancy rate (postcode 4566) | 4.38% (1.91% a year earlier) | SQM Research, Oct 2026 |
| Homes | 61% separate houses, 28% townhouses and semi-detached, 11% units | ABS Census 2021 |
| State school catchments | Mostly Noosaville State School and Sunshine Beach State High | Queensland Government, Jul 2026 |
| Public transport | Buses; no train station | Translink |
| Nearest regional hub | Noosa (major regional activity centre); Maroochydore 28 min | SEQ Regional Plan 2009–2031 |
| Biggest build nearby | Lake Macdonald Dam upgrade, 20 min | Seqwater, 2026 |
| Reported offences | 654 in 12 months: about 75 per 1,000 residents (Noosa: 50) | QPS Online Crime Map, Nov 2026 |
Is Noosaville a good place to live?
Noosaville suits downsizers, retirees and holiday-home buyers who want the river, the cafés and Hastings Street close by, and families after a quieter house inland. The trade-offs are high prices, flood checks near the river and canals, and a rental market shaped by holiday letting. At the 2021 Census, 61% of homes were separate houses and 39% townhouses or units, 47% were owned outright (Queensland: 29%), 61% of families were couples without children at home, the median age was 56 and the median household income was $1,399 a week (Queensland: $1,675).
It is really three suburbs in one, and each comes with its own checks.
| Part of Noosaville | What you get | What to check |
|---|---|---|
| Gympie Terrace and the riverfront | Units, townhouses and holiday apartments across the road from the river beaches and cafés | The flood map, the body corporate records and the letting rules |
| Noosa Waters and the canals | Canal-front houses with pontoons | The flood and storm tide maps, and the canal wall and pontoon |
| Inland streets, towards Noosa Civic and Eenie Creek Road | Family houses near the school and the shops | Road noise on the main roads, and the age of the house |
What is the median house price in Noosaville?
Noosaville’s median house value was $2,053,494 at the end of October 2026, 1.1% higher than a year earlier, according to Cotality, while three- and four-bedroom houses sold for medians of $1.95 million and $2.14 million over the past year (Domain). Units, the most traded homes here, had a median value of $1,119,739, and two-bedroom units sold for a median of $976,000 from 108 sales, up from $849,000 in 2022.
Market trends by bedrooms (sales in the 12 months to November 2026, Domain):
| Home | Median price | Average days on market | Auction clearance | Sold in 12 months | 2022 median |
|---|---|---|---|---|---|
| 3-bedroom house | $1,950,000 | 58 | 36% | 46 | $1,520,000 |
| 4-bedroom house | $2,140,000 | 48 | 19% | 60 | $1,920,000 |
| 5-bedroom house | $3,190,000 | 82 | – | 22 | $2,150,000 |
| 1-bedroom unit | $571,000 | 25 | – | 20 | $494,000 |
| 2-bedroom unit | $976,000 | 24 | – | 108 | $849,000 |
| 3-bedroom unit | $1,400,000 | 41 | – | 47 | $1,460,000 |
Growth over 12 months, 5, 9 and 17 years:
| Period | Houses | Units and townhouses | Source |
|---|---|---|---|
| 12 months to Oct 2026 | +1.1% | +1.1% | Cotality, median value |
| 5 years to Oct 2026 | +8.6% (1.7% a year) | +30.5% (5.5% a year) | Cotality, median value |
| 9 years, Oct 2017 to Oct 2026 | +109.4% (8.6% a year) | +153.6% (10.9% a year) | Cotality, median value |
| 17 years, May 2009 to Nov 2026 (postcode 4566) | $675,000 to $2,166,444, +221% (6.9% a year) | $398,000 to $1,099,592, +176% (6.0% a year) | SQM Research, asking prices |
Most of the house growth came before 2021: on Cotality’s figures, values rose 109% over nine years but only 9% over the last five. A 20- or 30-year sales median needs paid sales data such as Pricefinder.
A two-bedroom unit in Noosaville rents for about $780 a week: that was the median on new leases in the September quarter 2026, up from $760 a year earlier and $395 in September 2017, according to the Residential Tenancies Authority’s bond data. That is a 97% rise in nine years.
| September quarter | 2-bedroom unit, Noosaville (median weekly rent) |
|---|---|
| 2017 | $395 |
| 2019 | $400 |
| 2021 | $580 |
| 2022 | $580 |
| 2023 | $650 |
| 2024 | $650 |
| 2025 | $760 |
| 2026 | $780 |
In the same quarter four-bedroom houses rented for $1,300 a week, up from $575 in 2017, and two-bedroom townhouses for $800, up from $430 (RTA).
Rental yield and vacancy. Cotality puts Noosaville’s gross yield at 2.9% for houses and 3.9% for units and townhouses. A two-bedroom unit at the $976,000 median, rented at $780 a week, yields 4.2% before costs. SQM Research counted a vacancy rate of 4.38% for the 4566 postcode in October 2026, up from 1.91% a year earlier and above the 2.6% to 3.5% the REIQ treats as a healthy market. The sample is small, 27 listings among 617 rental properties, and holiday homes moving in and out of long-term letting can swing it.
Most of Noosaville is in the Noosaville State School and Sunshine Beach State High School catchments, going by the Queensland Government’s July 2026 maps, with the edges in the Sunshine Beach and Tewantin primary catchments and Coolum State High’s.
| State school | Share of Noosaville’s land in its catchment | 2025 score (Better Education) | Enrolment management plan |
|---|---|---|---|
| Noosaville State School | 77% | 85 | No |
| Sunshine Beach State School | 12% | 91 | Yes |
| Tewantin State School | 10% | 87 | No |
| Sunshine Beach State High School | 97% | 90 | Yes |
| Coolum State High School | 3% | 89 | Yes |
The shares are of land area, not homes, so put the exact address into the Queensland Government’s EdMap before you rely on a catchment. Sunshine Beach State School and both high schools enforce their catchments under enrolment management plans, so they take children from outside only when they have room; you prove the address with a current lease, a rates notice or an unconditional contract, plus a utility bill. Noosaville and Tewantin state schools were not on the Department of Education’s list of schools with plans when we checked. The scores are Better Education’s, a third party’s ranking built on NAPLAN results.
Noosaville is about 132 km north of the Brisbane CBD by road. Driving to King George Square takes 1 hour 30 minutes to 1 hour 50 minutes outside peak hour and 1 hour 40 minutes to 2 hours 30 minutes leaving at 7.30am on a weekday, and public transport, a bus and a train, takes about 3 hours, according to Google Maps.
| From Noosaville to | How | Typical time |
|---|---|---|
| Brisbane CBD (King George Square) | Car, leaving 7.30am weekday (132 km via the M1) | 1 hr 40 min to 2 hr 30 min |
| Brisbane CBD | Car, off-peak | 1 hr 30 min to 1 hr 50 min |
| Brisbane CBD | Bus 630 from Eumundi Road at Rene Street, then the train, leaving 8.04am weekday | 2 hr 58 min |
| Hastings Street, Noosa Heads | Car, off-peak | 10 min |
| Sunshine Coast Airport | Car, off-peak | 22 min |
| Sunshine Plaza, Maroochydore | Car, off-peak | 28 min |
| Sunshine Coast (Mooloolaba Beach) | Car, off-peak | 35 min |
| Brisbane Airport | Car, off-peak | 1 hr 25 min |
| Gold Coast (Surfers Paradise) | Car, off-peak | 2 hr 10 min to 2 hr 30 min |
On Census day 2021, 57% of workers drove or were driven to work, 1% took public transport, 3% walked and 23% worked from home.
Noosa is Noosaville’s hub. The South East Queensland Regional Plan 2009–2031, written when Noosa was part of the Sunshine Coast Regional Council, named Noosa one of the Sunshine Coast’s major regional activity centres, supporting Maroochydore, the coast’s only principal regional activity centre, 28 minutes away. The plan also listed the Noosa Business Centre Technology and Industrial Hub, in Noosaville, among the coast’s employment areas.
Noosa is set to grow slowly. The 2017 ShapingSEQ background paper on growth set Noosa a benchmark of 6,400 more homes between 2016 and 2041, the smallest of the nine councils in these reports.
The biggest build near Noosaville is Seqwater’s Lake Macdonald Dam Improvement Project, the rebuild of Noosa’s Lake Macdonald (Six Mile Creek) Dam near Cooroy, 20 minutes away.
- Why: to keep the dam meeting current safety standards and able to withstand extreme weather, Seqwater says.
- What it adds: a temporary upstream cofferdam, a new spillway and rebuilt earth embankments. When it is finished, the dam will hold the same volume of water at the same full supply level.
- Who: Seqwater, the bulk water supplier for South East Queensland.
- Where it is up to: early site works began in November 2024, the cofferdam was finished in April 2026, demolition of the old spillway began on 10 April 2026 with work around the clock, and two tower cranes went up in October 2026. Seqwater expects the project to take around five years, and the lake is held about 2 m below full supply while it runs.
- In the suburb: Noosa Council has been building new public toilets with a Changing Places facility at Quota Park on Gympie Terrace, due to finish in November 2026.
What it means if you buy in Noosaville: a safer dam for Noosa’s water supply, with the same storage when it is done. While the works run, expect a lower lake and recreation closures at Lake Macdonald, and construction traffic around the dam.
Tourism, hospitality and health are Noosaville’s biggest employers: the cafés, restaurants and holiday apartments along Gympie Terrace, Noosa Hospital on Goodchap Street, and the workshops, breweries and trades of the Noosa Business Centre. Hastings Street is 10 minutes away and Maroochydore 28.
- Jobs (2021 Census): professionals 20.9%, managers 17.9%, technicians and trades workers 12.6%, community and personal service workers 12.3%, sales workers 11.4%.
- Top industries: cafés and restaurants 5.4%, accommodation 4.8%, real estate services 2.7%, hospitals 2.2% and aged care 2.2%.
- Work patterns: 47.2% of adults were in the labour force, reflecting the older population, and 3.9% were unemployed (Queensland 5.4%).
Noosaville’s reported crime rate is higher than Noosa’s as a whole. It recorded 654 offences on the Queensland Police Service’s online crime map in the 12 months to 15 November 2026, about 75 for every 1,000 residents, against 50 per 1,000 across Noosa Shire (2,809 offences). Theft and traffic offences make up more than half, and the rate divides every offence by residents only, not the visitors who fill Gympie Terrace.
| Offence type | Noosaville, 12 months to 15 Nov 2026 |
|---|---|
| Other theft (not break-ins) | 253 |
| Traffic and related offences | 122 |
| Drug offences | 55 |
| Good order offences | 45 |
| Property damage | 43 |
| Fraud | 32 |
| Other | 31 |
| Unlawful entry (break-ins) | 31 |
| Assault | 27 |
| Unlawful use of a motor vehicle | 15 |
Police say the map’s figures are not official statistics and its locations show a general area; the rates use 2021 Census populations. Before you buy, look up your own street on the map and check where the offences cluster.
The river is Noosaville’s backyard: beaches, picnic parks, boat hire and restaurants along Gympie Terrace, with Noosa National Park and Hastings Street 10 minutes away. Ratings are Google’s, checked 16 November 2026.
Parks and the river
- Tewantin Noosa Lions Park, Gympie Terrace: 4.7 stars from 75 reviews.
- Noosa National Park, Noosa Heads: 4.8 from 6,894 reviews.
- Noosa Spit Recreation Reserve, Noosa Heads: 4.7 from 1,929 reviews.
Food and coffee
- Gusto Riverfront Restaurant, Gympie Terrace: 4.8 from 2,455 reviews.
- Noosa Boathouse, on the river at Gympie Terrace: 4.4 from 2,796 reviews.
- Mr Jones & Me, Weyba Road: 4.8 from 1,315 reviews.
- Depot Noosa, Gympie Terrace: 4.6 from 1,200 reviews.
- Lanai Noosa, Gympie Terrace: 4.9 from 357 reviews.
For kids
- Noosa River Pirate Playground, Gympie Terrace: 4.5 from 579 reviews.
- The Big Pelican, Gympie Terrace: 4.5 from 396 reviews.
- Terrace Marina Noosa, boat and jet ski hire, Gympie Terrace: 4.5 from 426 reviews.
- Noosa Mini Golf, Goldburg Court: 4.9 from 65 reviews.
For adults
- Heads of Noosa Brewing Co., Rene Street: 4.9 from 413 reviews.
- Land & Sea – Noosa Brewing Company, Venture Drive: 4.6 from 606 reviews.
- Seabourne Distillery, Rene Street: 5.0 from 137 reviews.
The local pub
The Villa Noosa Hotel, 19 Mary Street: rated 4.2 from 1,359 Google reviews, and our pick for a meal or a drink in Noosaville. In Noosa Heads, the Noosa Reef Hotel rates 4.4 from 1,825.
Check the flood map, the letting rules and the rent before you talk price in Noosaville. Near the river, the details decide whether a home is a good buy.
- Flood. Floodwater covered Gympie Terrace at the Eumundi Road and Hilton Terrace roundabout on 26 February 2022. Check Noosa Council’s flood mapping for the exact lot, and the storm tide map for canal homes.
- Body corporate and letting. Many units and townhouses near the river are holiday-let. Read the body corporate records and by-laws, and check Noosa Council’s rules on short-stay letting before you buy to rent out.
- Canal homes. Have the canal wall, pontoon and any boat ramp inspected, and ask who is responsible for maintaining them.
- The rent. With the postcode’s vacancy rate at 4.4% in October 2026, get two rent appraisals before you rely on a rent figure.
IPS Buyer’s Agents works only for buyers and has bought on the Sunshine Coast for clients, including at Mount Coolum, Bli Bli and Sippy Downs (see our client success stories). In Noosaville, Zian and I check the flood map, the body corporate and the letting rules before we talk price.
Comparing Noosaville with Noosa Heads, Tewantin or Sunshine Beach? Book a free call and tell us your brief. See how we work as a Noosa buyer’s agent, our guide to the Noosa property market and our other Noosa suburb reports.
Is Noosaville in Noosa Shire Council?
Yes. Noosaville is in Noosa Shire, on the Noosa River between Noosa Heads and Tewantin, about 132 km north of the Brisbane CBD by road, so its rates, planning and flood maps come from Noosa Council.
What is Noosaville’s postcode?
4566. SQM Research’s vacancy rate and asking prices for the postcode cover Noosaville, and the 2021 Census counted 5,157 homes in the suburb.
How far is Noosaville from Hastings Street?
About 10 minutes by car (6.5 km) outside peak times, according to Google Maps.
Why is Noosaville’s rental vacancy rate so high?
SQM Research counted 4.38% in October 2026, up from 1.91% a year earlier, from 27 listings among 617 rental properties. In a small market with many holiday homes, homes moving between holiday and long-term letting can swing the figure.
How many people live in Noosaville?
About 8,700. The 2021 Census counted 8,716 people with a median age of 56, and 47% of homes were owned outright (Queensland: 29%).
Does Noosaville flood?
Parts of it can. Floodwater covered Gympie Terrace at the Eumundi Road and Hilton Terrace roundabout on 26 February 2022, so check Noosa Council’s flood mapping for any home near the river or the canals.
How far is Noosaville from Sunshine Coast Airport?
About 22 minutes by car (27.0 km) outside peak times, according to Google Maps.
How many homes sell in Noosaville each year?
Around 300. Cotality counted 307 sales in the 12 months to October 2026, and two-bedroom units, the most traded home, sold in about 24 days on Domain’s figures.
- Cotality via OnTheHouse: Noosaville suburb profile (median values, growth, rents, yields), as at 31 October 2026
- Domain: Noosaville suburb profile, market trends by bedrooms, checked 16 November 2026
- Residential Tenancies Authority: median rents by suburb, September quarter 2026
- SQM Research: vacancy rates and asking prices for postcode 4566
- Australian Bureau of Statistics: 2021 Census QuickStats, Noosaville
- Queensland Government: state school catchments, July 2026
- Department of Education: school enrolment management plans
- Better Education: 2025 school scores
- Queensland Police Service: Online Crime Map, 16 November 2025 to 15 November 2026
- Queensland Government: South East Queensland Regional Plan 2009–2031, Part C (Sunshine Coast, which then included Noosa)
- Queensland Government: ShapingSEQ 2017, Background paper 1: Grow, Table 9 (dwelling supply benchmarks to 2041)
- Seqwater: Lake Macdonald Dam Improvement Project
- Noosa Council: works in progress
- Heritage Noosa: flooding, Gympie Terrace, Eumundi Road and Hilton Terrace roundabout, Noosaville, 26 February 2022
- Wikipedia: Noosaville, Queensland
- Google Maps: drive and transit times and ratings, checked 16 November 2026