
Capalaba QLD Suburb Profile 2026: House Prices, Rent, Schools and Lifestyle

By Tim AllenBuyer’s Agent and Director, IPS Buyer’s Agents
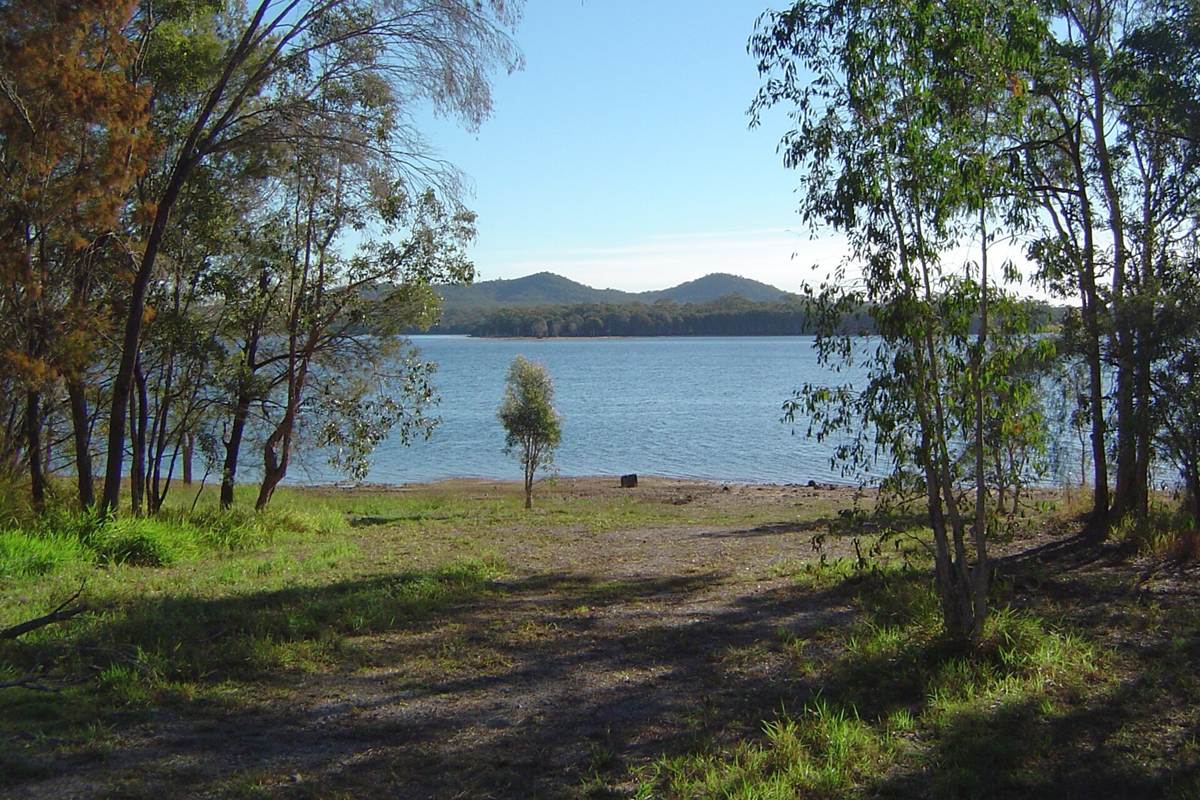
Leslie Harrison Dam from Allambee Crescent, June 2014. Photo: Shiftchange, CC0, via Wikimedia Commons.
Capalaba (postcode 4157) is one of the Redlands’ two main centres, on its western side next to Brisbane, home to about 18,000 people in Redland City, about 24 km south-east of the Brisbane CBD by road, around Tingalpa Creek and the Leslie Harrison Dam. Most homes are houses, with townhouses near the town centre, where a $250 million redevelopment is under way. In October 2026 the median house value was about $1.06 million, three-bedroom houses were renting for $700 a week, and the rental vacancy rate for the 4157 postcode was 0.59%.
Checked 16 November 2026. Every figure names its source, and the full list is under References at the end.
Capalaba at a glance
| Capalaba, QLD 4157 | Figure | Source |
|---|---|---|
| Council | Redland City Council | Queensland Government |
| Distance to Brisbane CBD | About 24 km by road; 28 min drive off-peak, 35 min to 1 hr 20 min leaving at 7.30am | Google Maps, Nov 2026 |
| Population | 18,002 people, median age 39 | ABS Census 2021 |
| Median house value | $1,062,022 | Cotality, Oct 2026 |
| Median price, 3-bedroom house | $980,000 (127 sales, 12 days on market) | Domain, 12 months to Nov 2026 |
| House value growth | +1.8% over 12 months, +57.6% over 5 years, +124.9% since Oct 2017 | Cotality, Oct 2026 |
| Median rent, 3-bedroom house | $700 a week, up 4% in a year | RTA, Sep quarter 2026 |
| Gross rental yield | Houses 3.5%, units and townhouses 4.0% | Cotality, Oct 2026 |
| Rental vacancy rate (postcode 4157) | 0.59% | SQM Research, Oct 2026 |
| Homes | 78% separate houses, 19% townhouses and semi-detached, 3% units | ABS Census 2021 |
| State school catchments | Capalaba State College, Coolnwynpin or Hilliard State School; Capalaba State College or Alexandra Hills State High | Queensland Government, Jul 2026 |
| Public transport | Capalaba bus station, buses to the city; no train station | Translink; Google Maps |
| Nearest regional hub | Capalaba itself (principal regional activity centre) | SEQ Regional Plan 2009–2031 |
| Biggest build nearby | Capalaba Town Centre Revitalisation ($250 million), in the suburb | Redland City Council, 2026 |
| Reported offences | 1,488 in 12 months: about 83 per 1,000 residents (Redland: 51) | QPS Online Crime Map, Nov 2026 |
Is Capalaba a good place to live?
Capalaba suits buyers who want a house around $1 million with the Redlands’ main shops, buses and Brisbane Airport within 20 minutes, and bushland along Tingalpa Creek. The trade-offs are traffic on the main roads, a town centre under construction until about 2028, and a reported crime rate above the Redlands’ average. At the 2021 Census, 78% of homes were separate houses and 19% townhouses or semi-detached, 42% were being paid off with a mortgage (Queensland: 34%), 26% of households rented, the median age was 39 and the median household income was $1,747 a week (Queensland: $1,675).
It is really three suburbs in one, and each comes with its own checks.
| Part of Capalaba | What you get | What to check |
|---|---|---|
| The town centre, around the shopping centres and the bus station | Townhouses and houses near the shops, buses and services | The redevelopment works, the body corporate records, and noise |
| Family streets | Houses on suburban blocks near the schools | Building, pest and asbestos checks on older homes |
| The bush side, along Tingalpa Creek and the dam | Bushland, parks and quieter streets | The koala habitat, flood and bushfire maps |
What is the median house price in Capalaba?
Capalaba’s median house value was $1,062,022 at the end of October 2026, 1.8% higher than a year earlier, according to Cotality, while three- and four-bedroom houses sold for medians of $980,000 and $1.17 million over the past year (Domain), up from $842,750 and $975,000 in 2025 and $660,000 and $800,000 in 2022. Units and townhouses had a median value of $766,720, and two-bedroom units sold for a median of $725,000, up from $430,000 in 2022.
Market trends by bedrooms (sales in the 12 months to November 2026, Domain):
| Home | Median price | Average days on market | Auction clearance | Sold in 12 months | 2022 median |
|---|---|---|---|---|---|
| 2-bedroom house | $695,000 | 20 | – | 19 | $380,000 |
| 3-bedroom house | $980,000 | 12 | 50% | 127 | $660,000 |
| 4-bedroom house | $1,170,000 | 16 | – | 95 | $800,000 |
| 5-bedroom house | $1,460,000 | 34 | – | 17 | – |
| 2-bedroom unit | $725,000 | 11 | – | 29 | $430,000 |
Growth over 12 months, 5, 9 and 17 years:
| Period | Houses | Units and townhouses | Source |
|---|---|---|---|
| 12 months to Oct 2026 | +1.8% | +10.5% | Cotality, median value |
| 5 years to Oct 2026 | +57.6% (9.5% a year) | +95.6% (14.4% a year) | Cotality, median value |
| 9 years, Oct 2017 to Oct 2026 | +124.9% (9.4% a year) | +134.1% (9.9% a year) | Cotality, median value |
| 17 years, May 2009 to Nov 2026 (postcode 4157) | $449,000 to $1,030,615, +130% (4.9% a year) | $299,000 to $726,318, +143% (5.2% a year) | SQM Research, asking prices |
The 17-year row covers the whole 4157 postcode, which includes Sheldon. A 20- or 30-year sales median needs paid sales data such as Pricefinder.
A three-bedroom house in Capalaba rents for about $700 a week: that was the median on new leases in the September quarter 2026, up from $675 a year earlier and $400 in September 2017, according to the Residential Tenancies Authority’s bond data. That is a 75% rise in nine years.
| September quarter | 3-bedroom house, Capalaba (median weekly rent) |
|---|---|
| 2017 | $400 |
| 2019 | $415 |
| 2021 | $470 |
| 2022 | $490 |
| 2023 | $590 |
| 2024 | $660 |
| 2025 | $675 |
| 2026 | $700 |
In the same quarter four-bedroom houses rented for $780 a week, up from $510 in 2017, and two-bedroom units for $550, up from $350 (RTA).
Rental yield and vacancy. Cotality puts Capalaba’s gross yield at 3.5% for houses and 4.0% for units and townhouses. A three-bedroom house at the $980,000 median, rented at $700 a week, yields 3.7% before costs. SQM Research counted a vacancy rate of 0.59% for the 4157 postcode in October 2026, well under the 2.6% to 3.5% the REIQ treats as a healthy market.
Capalaba is split between three main primary catchments, Capalaba State College, Coolnwynpin and Hilliard state schools, going by the Queensland Government’s July 2026 maps, and two high school catchments, Capalaba State College and Alexandra Hills State High.
| State school | Share of Capalaba’s land in its catchment | 2025 score (Better Education) | Enrolment management plan |
|---|---|---|---|
| Capalaba State College (primary) | 45% | 80 | No |
| Coolnwynpin State School | 23% | 77 | Yes |
| Hilliard State School | 22% | 88 | No |
| Alexandra Hills State School | 4% | 80 | No |
| Birkdale South State School | 4% | 85 | No |
| Bay View State School | 3% | 81 | Yes |
| Capalaba State College (secondary) | 67% | 77 | No |
| Alexandra Hills State High School | 33% | 79 | Yes |
The shares are of land area, not homes, so put the exact address into the Queensland Government’s EdMap before you rely on a catchment. Coolnwynpin, Bay View and Alexandra Hills State High enforce their catchments under enrolment management plans, so they take children from outside only when they have room; you prove the address with a current lease, a rates notice or an unconditional contract, plus a utility bill. The other schools were not on the Department of Education’s list of schools with plans when we checked. The scores are Better Education’s, a third party’s ranking built on NAPLAN results.
Capalaba is about 24 km south-east of the Brisbane CBD by road. Driving to King George Square takes about 28 minutes outside peak hour and 35 minutes to 1 hour 20 minutes leaving at 7.30am on a weekday, and the bus takes about 1 hour 14 minutes, according to Google Maps.
| From Capalaba to | How | Typical time |
|---|---|---|
| Brisbane CBD (King George Square) | Car, leaving 7.30am weekday (26.7 km via State Route 22 and the M1) | 35 min to 1 hr 20 min |
| Brisbane CBD | Car, off-peak | 28 min |
| Brisbane CBD | Bus 275, leaving 7.32am weekday | 1 hr 14 min |
| Westfield Carindale | Car, off-peak | 12 min |
| Cleveland station | Car, off-peak | 12 min |
| Brisbane Airport | Car, off-peak | 20 min |
| Gold Coast (Surfers Paradise) | Car, off-peak | 1 hr |
| Sunshine Coast (Mooloolaba Beach) | Car, off-peak | 1 hr 20 min to 1 hr 30 min |
On Census day 2021, 70% of workers drove or were driven to work, 3% took public transport and 13% worked from home.
Capalaba is a hub in its own right. The South East Queensland Regional Plan 2009–2031 named Capalaba and Cleveland the Redlands’ two principal regional activity centres, the level below the Brisbane CBD. Westfield Carindale, the nearest of Brisbane’s principal centres, is 12 minutes away.
The Redlands grow mostly by infill. The 2017 ShapingSEQ background paper on growth set Redland City a benchmark of 17,200 more homes between 2016 and 2041, 12,500 of them in existing urban areas, which in Capalaba includes the homes planned in the town centre redevelopment.
The biggest build in Capalaba is the $250 million Capalaba Town Centre Revitalisation, on a 1.55-hectare council site in the middle of the suburb, which Redland City Council is delivering through its company, Redland Investment Corporation, with Shayher Group as development partner.
- Why: to renew the town centre with new council and community buildings, shops and homes.
- What it adds: a new library, customer service centre and community hall, an arts centre, a village green with a large screen in an entertainment and dining precinct, shops, and mixed-use residential and commercial buildings.
- Who: Redland City Council and Redland Investment Corporation, with Shayher Group.
- Where it is up to: the project received development approval in June 2024. When the sod was turned, the council’s Redlands Coast Today reported on 2 June 2026 that stage one, the library, customer service centre, community centre with arts facilities and three storeys of offices, was expected by 2028.
What it means if you buy in Capalaba: a renewed centre with a library and village green by about 2028, and more homes in the centre itself. Expect construction around the town centre until then. The same project is the biggest build near Alexandra Hills, 4 minutes away.
Capalaba’s own town centre and shopping centres are the closest jobs, with Brisbane Airport 20 minutes away and the CBD 28 minutes off-peak.
- Jobs (2021 Census): technicians and trades workers 16.9%, professionals 16.7%, clerical and administrative workers 15.4%, community and personal service workers 11.6%, managers 10.6%.
- Top industries: hospitals 4.8%, supermarkets 2.9%, social assistance 2.5%, aged care 2.4% and primary schools 2.3%.
- Work patterns: 65.0% of adults were in the labour force and 4.5% were unemployed (Queensland 5.4%).
Capalaba’s reported crime rate is higher than the Redlands’ as a whole. It recorded 1,488 offences on the Queensland Police Service’s online crime map in the 12 months to 15 November 2026, about 83 for every 1,000 residents, against 51 per 1,000 across Redland City (8,152 offences). A third were “other theft”, the group that includes shoplifting, and Capalaba has two shopping centres and the bus station; drug offences were another fifth.
| Offence type | Capalaba, 12 months to 15 Nov 2026 |
|---|---|
| Other theft (not break-ins) | 511 |
| Drug offences | 295 |
| Traffic and related offences | 181 |
| Other | 96 |
| Property damage | 86 |
| Good order offences | 86 |
| Assault | 83 |
| Unlawful entry (break-ins) | 69 |
| Fraud | 49 |
| Weapons offences | 32 |
Police say the map’s figures are not official statistics and its locations show a general area; the rates use 2021 Census populations. Before you buy, look up your own street on the map: the quieter streets on the bush side can look very different from the town centre.
Capalaba Regional Park, IndigiScapes and the bushland along Tingalpa Creek are Capalaba’s own, with Cleveland 12 minutes away. Ratings are Google’s, checked 16 November 2026.
Parks and bushland
- Capalaba Regional Park, Pittwin Road North: 4.7 stars from 609 reviews.
- Redlands IndigiScapes Centre, Runnymede Road: 4.5 from 584 reviews.
- John Frederick Park, Old Cleveland Road: 4.3 from 75 reviews.
- Wentworth Drive Park playground: 4.4 from 30 reviews.
Food and coffee
- Costa’s Seafood Cafe, Old Cleveland Road: 4.6 from 2,321 reviews.
- Hashtag Burgers and Waffles, Finucane Road: 4.6 from 1,048 reviews.
- 107 Coffee Terminal / Sabroso, Capalaba Central: 4.8 from 1,027 reviews.
- Capalaba Outpost, Mount Cotton Road: 4.7 from 223 reviews.
- Hono Japanese Restaurant, Old Cleveland Road: 4.9 from 201 reviews.
For kids
- Zone Bowling Capalaba, Currumbin Court: 4.5 from 1,007 reviews.
- Capalaba Regional Park playground: 4.7 from 19 reviews.
- IndigiScapes playground, Runnymede Road: 5.0 from 6 reviews.
- Wall Walkers Bouldering, Jones Road, for older kids: 5.0 from 92 reviews.
For adults
- Bacchus Brewing Co., Christine Place: 4.6 from 298 reviews.
- Capalaba Sports Club, Ney Road: 4.2 from 1,146 reviews.
The local pub
The Capalaba Tavern, 30 Old Cleveland Road: rated 4.6 from 3,538 Google reviews, and our pick for a meal or a drink in Capalaba.
Check the koala map, the flood map and the works before you talk price in Capalaba. The location is easy to like, and these are the things that change a price.
- Koalas. Koala habitat mapping can limit clearing and building on a lot, especially near bushland. Check Redland City Council’s and the state’s koala maps before you plan an extension or a new house.
- Flood. Check Redland City Council’s flood mapping for homes near Tingalpa Creek, the dam and the smaller creeks.
- The works. Check how close a home is to the town centre redevelopment, which runs until about 2028, and visit in the morning peak.
- Older homes. The QBCC says most homes built before 1990 contain some asbestos, so for an older home book building, pest and asbestos checks before you sign.
IPS Buyer’s Agents knows Capalaba first-hand. My first 12 years were in Alexandra Hills, the next 13 in Capalaba, and I’ve owned two rentals in Alex Hills. Knowing a suburb doesn’t change how we buy: Zian and I still check the koala map, the flood map and the building report before we talk price.
Comparing Capalaba with Alexandra Hills, Birkdale or Sheldon? Book a free call and tell us your brief. See how we work as a Redlands buyer’s agent, our guide to the Redlands property market and our other Redlands suburb reports.
Is Capalaba in Redland City Council?
Yes. Capalaba is in Redland City, on its western side next to Brisbane, about 24 km south-east of the Brisbane CBD by road, so its rates, planning and flood maps come from Redland City Council.
What is Capalaba’s postcode?
4157, which it shares with Sheldon. Postcode figures, such as SQM Research’s vacancy rate and asking prices, cover both suburbs.
Does Capalaba have a train station?
No. Capalaba has a bus station, and the 7.32am route 275 reached King George Square in 1 hour 14 minutes on Google Maps. Cleveland station is 12 minutes away by car.
When will the new Capalaba library open?
Stage one of the Capalaba Town Centre Revitalisation, with the new library, customer service centre and community centre, is expected by 2028, Redland City Council’s news site reported when the sod was turned in June 2026.
How many people live in Capalaba?
About 18,000. The 2021 Census counted 18,002 people with a median age of 39, and 78% of homes were separate houses.
How far is Capalaba from Brisbane Airport?
About 20 minutes by car (24.0 km) outside peak times, according to Google Maps.
Why is Capalaba’s crime rate higher than the Redlands’?
A third of its 1,488 offences in the year to 15 November 2026 were “other theft”, which includes shoplifting, and Capalaba has two shopping centres and the bus station. Drug offences were another fifth.
How many homes sell in Capalaba each year?
Around 340. Cotality counted 341 sales in the 12 months to October 2026, and three-bedroom houses sold in about 12 days on Domain’s figures.
- Cotality via OnTheHouse: Capalaba suburb profile (median values, growth, rents, yields), as at 31 October 2026
- Domain: Capalaba suburb profile, market trends by bedrooms, checked 16 November 2026
- Residential Tenancies Authority: median rents by suburb, September quarter 2026
- SQM Research: vacancy rates and asking prices for postcode 4157
- Australian Bureau of Statistics: 2021 Census QuickStats, Capalaba
- Queensland Government: state school catchments, July 2026
- Department of Education: school enrolment management plans
- Better Education: 2025 school scores
- Queensland Police Service: Online Crime Map, 16 November 2025 to 15 November 2026
- Queensland Government: South East Queensland Regional Plan 2009–2031, Part C (Redland)
- Queensland Government: ShapingSEQ 2017, Background paper 1: Grow, Table 9 (dwelling supply benchmarks to 2041)
- Redland City Council: Capalaba Town Centre Revitalisation Project
- Redlands Coast Today (Redland City Council): construction begins on master-planned Capalaba redevelopment, 2 June 2026
- Wikipedia: Capalaba, Queensland
- Google Maps: drive and transit times and ratings, checked 16 November 2026